
ABSTRACT
Not long after Uber left the business in Indonesia in 2018, increasing numbers of ride-hailing users in Indonesia have been dominated by Gojek and Grab, with more than 100 million users downloaded each of their applications. We don‘t know how the recent Covid-19 pandemic — when governments urged people to work from home and applying social distancing — will affect ride-hailing businesses, but this research aims to find out which dominant factors influence customer loyalty in ride-hailing service in Surabaya, Indonesia. Data have been collected using questionnaires from 400 participants in Surabaya by simple random sampling which then processed using SPSS 25.00. This research applies models of service quality, service benefit, price, corporate image, system quality, consumer (or customer) satisfaction, and consumer loyalty, which are important for the companies to be competitive. Results show that, compared to other four factors, price becomes the most dominant factor that influences customer loyalty. It is hoped that results of this study will give further insight into the ride-hailing services particularly in filling the gap of the relationship between these variables and customer loyalty, as much as they can be useful for business communities to ponder about the importance of customer loyalty in determining better business performance. To enrich the findings, further study can be developed using the above variables to investigate longer users in various other cities.
Keywords: customer loyalty, customer satisfaction, price, public transportation, ride-hailing
I. INTRODUCTION
The development of application-based transportation using smartphone apps or commonly called ―online transportation‖ in Indonesia has remarkably grown. It revolutionizestransportation business and helped in solving road congestion in big cities such as Indonesia‘s capital city Jakarta and second largest city Surabaya in East Java. In this technology and customers driven era, their customers (or consumers)1 have been picking up from time to time (and might only disturbed after the recent Coronavirus (Covid-19) pandemic, in which further study still need to be conducted). Indonesian-based company, Gojek, offers various services from a ride-hailing to a one-stop app following clients in Southeast Asia‘s largest economy to make online payments and order everything from food, groceries to massages (Potkin, August 17, 2018). This innovation was introduced in 2010, however five years later, Gojek has moved its business forward with 800 motorcycle drivers in capital city Jakarta and four neighboring cities: Bogor, Depok, Tangerang, and Bekasi. Until 2018, there were 125 million users who downloadedGojek‘s apps, with around 15 million active users every week (Wardani, March 6, 2019). In the meantime, Gojek‘s competitor, Grab, a ride-hailing service provider from Singapore entered Indonesian market in 2012. At the beginning Grab only offered car services, and only started motorbike service in mid-2015. In 2016 Grab succeeded to have 300.000 bike drivers as their partners. In 2018 numbers of users who downloaded the Grab application reached more than 100 million, with 3.5 million transactions a day, using both cars and bikes whose numbers have stretched out to more than two million drivers (Paskalis, March 27, 2018). After Uber stopped its business in Indonesia in 2018, practically both Grab and Gojek became market leaders in ride hailing services business. The promising number of online transportation users give an opportunity for ride-hailing providers to always improve their services to keep their customers satisfied and loyal. In part of achieving long-term success in the business, the company should be able to identify and understand their customer needs and wants more effectively than their competitors (Consuegra, Molina, and Esteban, 2007). In addition, service marketing is different to goods marketing, and it has more complexity to deal with. In service industries, there are some characteristics which differ it from other industries (Intangible, Heterogeneity, Perishability, and Inseparability). It requires better understanding from the marketers, so they can deliver customer‘s needs, value, and keeping their promises, then all of these can keep them loyal to the company. This is particularly true in the case of ride-hailing business. In Indonesia, both service providers, Gojek and Grab, compete to offer better services and value to their customers. Their offerings not only focus on the price element, but also other elements such as service benefit, service quality, application system quality, and the corporate image. All these offerings adapt consumers’ own needs and preferences. Service benefit means any structured marketing efforts that reward, therefore encourage loyal buying behavior, which is potentially beneficial to the firm, it includes loyalty points that customers earned after use of their services (Magatef and Tomalieh, 2015, p.79). While service quality is the capabilities of the ride-hailing providers to deliver better service than its customer‘s expectations, this element includes the reliability and responsiveness from the service providers itself. Application system quality is focusing on the ease of use of the ride-hailing applications for the consumer to fulfill their needs. Then, the corporate image talks about what kind of value, reputation, and identity that company tries to offer to its customer, which it distinguishes them from competitors. Data from Indonesian Consumers Foundation (Yayasan Lembaga Konsumen Indonesia) said that, one of the main reasons why people prefer more to use online transportation service is because the fixed and cheap price that company offers, it gives more comfort, and more safety than others (Riana, May 12, 2017). Another study from the International Transport Forum found that service quality has an important influence on the development of the ride-hailing service industry. This quality includes the safety aspects, physical facility, driver‘s capability, and company‘s level of responsiveness in dealing with customer‘s needs. This aspect can influence consumer satisfaction, and later their loyalty in using this service. Furthermore, price also has other effects on customers loyalty and satisfaction. Every customer has his/her own price acceptability range, and different customers also have different thresholds in their perception regarding what price that is still acceptable within their ranges (Mamun, Rahman, & Robel, 2014, p.2). This acceptable range may be able to influence their loyalty, such as if the price offering is still in their range, they may be interested to use the services. However, when the price is higher than their acceptable range, they may select other transportation options (p.2). Another research from Medici found that loyalty programs as part of service benefit has a significant effect on increasing the number of ride-hailing users. It is also able to keep them loyal with one provider, instead of changing to other providers. In some ways, corporate image and system quality can also influence customer loyalty. Customers are more intended to use a service when the providers can offer a value that is suitable with their preferences (Lovely Professional University, 2012, p. 197). When the company can deliver this value consistently, it will raise loyaltytoward the company because this value can create a relationship between customer and company. On the other side, system quality also affects consumer satisfaction and loyalty, because the system itself is the platform to use the services. The company must ensure that the application system is easy-to-use and has clear navigation tools to drive consumers in choosing what kind of services that they want to use to fulfill their needs. This system quality also relates with the conversion rate, which means how many customers who will complete (finalize) their purchase on that platform. In this m-commerce era, this conversion rate is important to show how good the system is in part of facilitating customer purchase journeys (E-consultancy, 2012, p.5). In part of increasing loyal customers, the company should keep all of these variables well-delivered to its customers through whole ride-hailing service offerings, because when customers feel satisfied with the services that they use, either from which elements, it can influence them to buy or use it again and again. These kinds of customers will become loyal to the company as well as its brand and product (Mamun, Rahman, & Robel, 2014). Having a loyal customer is very important for every company in parts of building brand equity and to survive in this intense market competition by having a good position of market share. Since ride hailing service was booming in Indonesia for the last few years, there are still limited numbers of studies that analyze this new invention development, especially measuring correlation between these variables (service quality, service benefit, price, corporate image, and system quality) and customer loyalty variable. For example, we can learn from research conducted by Octaria (2016), which focused more on analyzing the evaluation of Gojek Campaign Strategy, and research from Wahid and Puspita (2017), that focused on analyzing Gojek strategy on increasing the level of Brand Awareness. The results show that some of Gojek‘s PR activities such as publication, establishing good relationships with society, cooperating with other companies, creating positive image, and providing service and new features for the society are able to increase and strengthen brand awareness toward Gojek. However, there are few studies that look intohow companies maintain their customer loyalty and other variables which may influence it. A study by Khuong and Dai (2016) uncovered that price and other elements of service quality, which are reliability and responsiveness, have direct impact on increasing consumer loyalty among local taxi companies in Hanoi. Another study from Phuong and Trang (2018) found the influence of system quality and service quality on the online repurchase intention. Fewer studies have considered consumer satisfaction as a moderator on relation between these variables and consumer loyalty. The above study by Khuong and Dai (2016) found indirect influence of comfort and price elements become significant factors that influence consumer satisfaction, which precede into consumer loyalty. Moreover, they also noticed that when companies want to increase satisfaction levelsin the ride-hailing business, they should pay more attention to comfort element and adjust the price appropriately. Consequently, through the intervening factor of consumer satisfaction, the study indicated that both factors can affect consumer loyalty. Many previous studies which examine factors that influence consumer loyalty in the ride-hailing industry mostly use some of these elements (service quality and price). However, there is no study that use corporate image and service benefit elements to find out its relations on consumer loyalty, nor is there a study that puts those elements together to find their relation on influencing consumer loyalty in the ride-hailing industry. Therefore, based on the above facts, it appears that more research is necessary to understand the role of those variables in the formation of customer loyalty, especially in the ride-hailing industry. Since there is no single research used as its parameter to measure the mentioned business, this study will figure out what factors can influence customer‘s loyalty toward a brand or services. Hence, this study aims to find out what are the dominant factors that influence customers‘ loyalty in ride-hailing services of Grab and Gojek in Surabaya. Specifically, this study attempts to evaluate what dominant factors can influence consumers‘ loyalty, i.e. which of those five variables — service quality, service benefit, price, corporate image, and system quality — become the most influencing element to consumers loyalty through customer satisfaction. Although there are studies on the usage of online services in many industries such as airlines ticketing, online shopping, etc., apparently there is a research gap between these variables and consumer loyalty of ridehailing businesses in Indonesia. Therefore, the results of this empirical testing will give further insight into the ride-hailing services particularly in filling the gap of the relationship between thosevariables and consumer loyalty.Additionally, this study will be useful for Indonesian business communities to ponder about the importance of customer loyalty in determining better business performance. Lastly, since this study has only delved into the ride hailing services users in Surabaya city in the last two months, further study can investigate more towards longer users and/or in various other cities.
II. THEORETICAL FRAMEWORK
Service Quality
Service quality is determined by the gap between customers‘ perceived service performance and their evaluation after they receive the service (Alamgir and Shamsuddoha, 2003, p.1). Furthermore, Zeithaml, Bitner, and Gremler (2018) defined perceived service as the difference between what a firm promises about a service and what it delivers (p.419). In the service industry, dimension of service quality is important because service is intangible. It is different with the goods industry, where the evaluation of product quality can be done before the purchase. However, in the service industry, especially ride-hailing service, users have limited access to any benefit and experience until the start of a journey. According to Zeithaml, Bitner, and Gremler (2018), there are five dimensions to measuring service quality, these dimensions represent how consumers organize information about service quality in their mind. Here are the five dimensions:
a. Reliability: refers to ability to perform the promised service dependably and accurately.
b. Responsiveness: refers to the willingness to help customers and provide prompt service. It emphasizes on attentiveness and promptness in dealing with customer requests, questions, complaints, and problems.
c. Assurance: emphasizes on employee‘s knowledge and courtesy and their ability to inspire trust and confidence.
d. Empathy: refers to caring, individualized attention given to customers. Customers want to feel understood by and important to firms that provide service to them.
e. Tangibles: refers to appearance of physical facilities, equipment, personnel, and communication materials are important elements of service quality.
Service Benefit
Service benefit refers to the information regarding the benefit that customers will get if they use certain product or services. Nowadays, many companies give more benefits to their customers as an appreciation for using their services and to retain their loyalty, through many programs, particularly what is called a ―loyalty program‖. According to Sharp and Sharp (1997) quoted in Magatef and Tomalieh (2015, p.79), loyalty programs are structured marketing efforts that reward, and therefore encourage, loyal buying behavior, which is potentially beneficial to the firm. Loyalty programs encourage consumers to shift from single-period decision making to multiple-period decision-making (Magatef and Tomalieh, 2015). A company offers this reward program to customers who frequently makepurchases, and also aim to persuade other customers to use their service as well. The goal of customer loyalty programs is to get loyal customers. Furthermore, according to Joniken (2014), loyalty program is important as tools to minimizing switching decisions among customers and are used in all fields of retailing and consumer services (p.34).
Price
Price is the amount of money charged for a product or a service (Kotler & Armstrong, 2012, p.290). According to many previous studies, price is an important determinant factor in purchasing and post-purchasing process, the central role of price is especially well recognized as an important variable in services with complex structure, rather than tangible product (Maztler, Würtele, and Renzl, 2006, p.217). Furthermore, in many marketing literatures price element in service industry is indicated as the most important factor, influencing the level of consumers‘ satisfaction, because if consumer estimate the value of obtained service, they usually think of price (Virvilaite, Saladiene, and Skindaras, 2009, p.97). There are six dimensions of price satisfaction, which cannot be separated from understanding the consumer‘s perception regarding price in the service industry. These dimensions are: (Maztler, Würtele, and Renzl, 2006)
a. Price Transparency: It exists when the customer can easily get a clear, comprehensive, current, and effortless overview about the company’s quoted price (Diller, 1997, on Maztler, Würtele, and Renzl, 2006, p.219).
b. Price-Quality Ratio: It can be determined as a cognition-based construct that captures any benefitsacrifice discrepancy (Lam et al, 2004, on Maztler, Würtele, and Renzl, 2006, p.220).
c. Relative Price: It is the dimension when consumerscompare a company’s price offering to competitor‘s offering.
d. Price Confidence: It focuses on a question regarding to what extent the consumer believes that an offered price is currently favorable (Diller, 2000, on Maztler, Würtele, and Renzl, 2006, p.221).
e. Price Reliability: It is defined as fulfillment of raised price expectations and the prevention of negative surprises (Diller, 1997, on Maztler, Würtele, and Renzl, 2006, p.221). Consumers will perceive a high level of price reliability, when there are no hidden costs, and when the price changes, they will be informed properly and in a timely manner.
f. Price Fairness: It focuses on the consumer’s perception of whether the difference between the socially accepted price or another comparative party is reasonable, acceptable, and justifiable.
Corporate Image
It is the immediate mental picture that audiences have of an organization (Gray & Balmer, 1998, p.697). This image was formed along with previous experiences with an organization, which are stored in memory and transformed into sense based on stored categories (Hu, Kandampully, and Juwaheer, 2009). Clearly, once a customer has had a first service encounter with the company, their image will influence further activities regarding the company‘s product or service. Therefore, it is important to develop a strong corporate image because it can lead to customer preference for first time customers as well as loyalty for existing customers (Bravo, Montaner, and Pina, 2010). Moreover, according to Grönroos (1982), having a good image is extremely important for the service company and is to a great extent determined by customers‘ assessment of the services they receive (on Richard & Zhang, 2012, p.572). There are some elements that create and become a part of corporate image itself, these are:
a. Corporate Reputation: It refers to a company’s stakeholder‘s overall impression of the company performance over time (Richard & Zhang, 2012, p.572). It indicates a value judgement about the company‘s attributes that they use to engage with their customer (Gray & Balmer, 1998, p.697).
b. Corporate Value: It is the ratio of perceived benefits of the service to be purchased to price and other added cost (Lovely Personnel University, 2012, p.197). The customer has to endure monetary and other costs for the service.
c. Corporate Identity: It is the reality and uniqueness of the company that distinguish them with others.
System Quality
It refers to consumer‘s perception of information retrieval and delivery of a mobile commerce application performance (Phuong and Trang, 2018, p.80). Ridesharing nowadays has become far more efficient and widespread with services due to the ability of mobile applications and internet communications to provide real-time information for rides (Siddiqi &Buliung, 2013, on Suhami, Talib, Bachok, & Saleh, 2018, p.6). This enables applicants to systematize the time before they take the trip, with passengers picked up and dropped off along the way. A virtual transportation concierge that can check real-time conditions of the transportation system is important for them to control the best schedule, travel, and mode choices that used to accomplish the activities in a timely and efficient manner (Miller, 2009, on Suhami, Talib, Bachok, & Saleh, 2018, p.6). There are four dimensions to measuring system quality of an app platform, which are:
a. Easy-of-use: refers to the degreeof a person’s perception that using the system is free of effort.
b. Navigation: refers to evaluation of links to needed information.
c. Interactivity: refers to the degree of accessing search engines and the personal design.
d. Accessibility: refers to speed of access and availability of systems.
Consumer Satisfaction
Consumer Satisfaction can be seen as the customer‘s response to the evaluation of the perceived discrepancy between prior expectation (or some other norm of performance), and actual performance of the product as perceived after its consumption (Tse& Wilton, 1988, on Richard & Zhang, 2012, p.573). It also refers to the consumer’s evaluation of a product or service in terms of whether that product or service has met the customer‘s needs and expectations. Failure to satisfy consumer‘s needs and expectations is assumed to result in dissatisfaction with the product or service. (Zeithaml, Bitner, and Gremler, 2018, p.80). In this case, ride-hailing service providers also should pay more attention regarding the element of customer satisfaction, because it may lead to customer loyalty. Selnes (1993) (quoted by Richard & Zhang (2012, p.573) discovered that consumers may be loyal with a certain product or service because they feel satisfied with it and tend to continue the relationship with the company. Furthermore, Schultz and Bailey (2000) contended that consumer satisfaction is a good starting point to developing and measuring the level of consumer loyalty, because a satisfied customer tends to remain more loyal with the brand or service, than an unsatisfied consumer (on Richard & Zhang, 2012, p.573).
Consumer Loyalty
Good customer relationship management creates customer delight. In turn, delighted customers remain loyal and talk favorably to others about the company and its products (Kotler and Armstrong, 2012, p. 20). As markets become more competitive, many companiesrealize the importance of retaining current customers and some have initiated a variety of activities to improve the level of customer loyalty (McMullan and Gilmore, 2008, p.1085). Indeed, the benefits from loyalty are very promising and it is widely recognized within the business. These include lower costs associated with retaining existing customers, rather than constantly recruiting new ones, especially in the mature and competitive market (Ehrenberg and Goodhardt, 2000). The relationship between competition and loyalty becomes more intense as the level of competition rises, especially in the services industry where there is a wide range of choices and rapidly emerging innovative products and services (Stevens, 2000). Consumer loyalty is one of the most significant contemporary strategies, helping to ensure not only the company‘s business success and its loyal customers benefits, but also long-term customers and company relations, maintaining and enhancing customer loyalty, aimed to benefit both parties (Išoraitè, 2016, p.292).
Research Hypotheses
Based on the theories elaborated above, at least there are eleven hypotheses to be exercised on this research:
H1: Service Quality has positive and significant influence on Consumer Loyalty in Ride-Hailing Services in Surabaya.
H2: Service Benefit has positive and significant influence on Consumer Loyalty in Ride-Hailing Services in Surabaya.
H3: Price has positive and significant influence on Consumer Loyalty in Ride-Hailing Services in Surabaya.
H4: Corporate Image has positive and significant influence on Consumer Loyalty in Ride-Hailing Services in Surabaya.
H5: System Quality has positive and significant influence on Consumer Loyalty in Ride-Hailing Services in Surabaya.
H6: Service Quality and Consumer Satisfaction have positive and simultaneous influence on Consumer Loyalty in Ride-Hailing Services in Surabaya.
H7: Service Benefit and Consumer Satisfaction have positive and simultaneous influence on Consumer Loyalty in Ride-Hailing Services in Surabaya.
H8: Price and Consumer Satisfaction have positive and simultaneous influence on Consumer Loyalty in Ride-Hailing Services in Surabaya.
H9: Corporate Image and Consumer Satisfaction have positive and simultaneous influence on Consumer Loyalty in Ride-Hailing Services in Surabaya.
H10: System Quality and Consumer Satisfaction have positive and simultaneous influence on Consumer Loyalty in Ride-Hailing Services in Surabaya.
H11: Consumer Satisfaction have positive and significant influence on Consumer Loyalty in RideHailing Services in Surabaya.
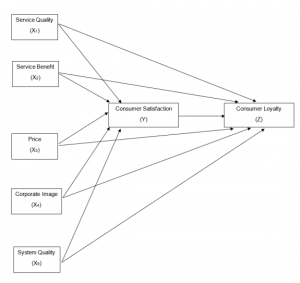
Conceptual Framework
This study is using a quantitative research method, with type of research is causal research to obtain the ideal results. Quantitative research is the method to explain an issue or phenomenon through gathering data in numerical form and analyzing with the aid of mathematical methods; in particular statistics (Aliaga& Gunderson, 2002, on Apuke, 2017). While causal research is a form of study that tries to identify and determine the cause and effect of the relationship between two or more groups. The paradigm that was used in this research is a positivism paradigm. Because it assumes that reality exists independently of humans. It strives to understand the social world like the natural word. In nature, there is a cause-effect relationship between phenomena, and once established, they can be predicted with certainty in the future. In this paradigm, it is applied in the similar way (Rehman &Alharthi, 2016). In this study, data analysis is conducted using Microsoft Excel and SPSS 25.0. In parts of data collection, 400 respondents participate in this survey. All respondents have met the criteria to participate in this study, such as, respondents are the ride-hailing users in Surabaya, they use either Go-Ride (of Gojek) or GrabBike service, and they have also used the service for at least (minimum) 10 times in the last two months. Respondents‘ characteristics are divided into 4 parts, which are, gender, ages, occupation, and main service provider preference. In parts of analyzing data, in this study researchers use several techniques, such as, correlation analysis, regression analysis (both simple and multiple), T-Test, F-Test, and Path analysis. According to Gogtay&Thatte (2017), correlation analysis is a term used to denote the association or relationship between two (or more) quantitative variables (p.78). It is fundamentally based on the assumption of a straight-line (linear) relationship between the quantitative variables. Furthermore, simple regression analysis is used to study the linear relationship between a dependent variable (Y) and an independent variable (X) (Schneider, 2010, p.767). A simple regression could be analyzed based on the functional relationship or causal relationship between independent variable and dependent variable (Ridwan &Kuncoro, 2013, p.84). While multiple regression provides an attempt to account for variation of the independent variables in the dependent variable synchronically (Ünver&Gamgam, 1999, in Uyanik&Güler, 2013, p.235). The assumption of multivariate regression analysis is normal distribution, linearity, freedom from extreme values and having no multiple ties between independent variables. Individual Parameter Significance Test (T-Test) is a type of inferential statistics used to determine if there is a significant difference between the means of two groups, which may be related in certain features (Kenton, 19 February 2020). Whereas, F-Test is used in regression analysis to test the hypothesis that all model parameters are zero. It is also used in statistical analysis when comparing statistical models that have been fitted using the same underlying factors and data set to determine the model with the best fit (Kissel &Poserina, 2017). Moreover, Path analysis is a variation of multiple-regression analysis and is useful for analyzing a number of issues involved in causal analysis (Stage & Carter, 2015, p.5). With Path analysis, researchers conduct a series of regression to analyze influences on dependent variables within the model. It aims to provide estimates of the magnitude and significance of hypothesized causal connections among sets of variables displayed usingPath diagrams.
III. RESULTS AND DISCUSSION
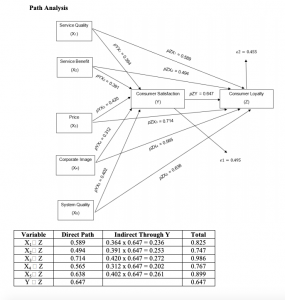
Our surveys on respondents‘ profile showed that out of 400 respondents, 201 (50.2%) were females and 199 respondents (49.8%) were males. This indicates that the frequent users of ride-hailing in Surabaya are females. This finding was in line with data from Indonesian Consumer Community (KomunitasKonsumen Indonesia) in 2019, which showed that women dominated the ride-hailing service users (Indotelko, July 31, 2019). In term of age group, users with age range from 18 to 29 become most ride-hailing users with total number of 157 respondents (39.3%). It is followed by 135 respondents (33.8%) on the age range of 30 until 39 years old, 61 respondents (15.2%) who have age range between 40 until 45 years old, and 31 respondents (7.8%) who are on the age above 55 years old. Whereas respondents on the age range of below 18 years are in the smallest position, with only 16 respondents (4%). This finding is similar with the study from Communication Study Center (Pusat Kajian Komunikasi or PKK) University of Indonesia that found that most ride-hailing users are in the age range of 20 until 30 years old (Haryanto, May 9, 2017). Whereas, a survey by ecommerceIQ argued that 57% of their respondents who used online transportation were in the range of age 18 until 29 years old (Jakarta Post, February 20, 2018). We also observed that ride-hailing users in Surabaya are dominated by workers with total 165 respondents (41.3%), followed by students (23%), entrepreneur (21.8%), and housewives (14%). The result of this study based on respondents‘ occupation is similar with the data from Fortune Agency findings which say that the presence of ride-hailing service has changed workers‘ behavior regarding public transportation usage in major cities in Indonesia (Chandler, March 20, 2019). Fortune Agency argues that workers have become major users of online transportation in metropolitan cities in Indonesia. Most of them think that ride-hailing service can ease their mobility due to traffic congestion in metropolitan cities. The survey also indicated that majority of respondents were using Grab with total 239 respondents (59.7%), while the rest (40.3%) are Gojek‘s users. This finding is similar with previous researches conducted by Spire Research and Consulting, which also showed that Grab have been preferable by users than Gojek. Based on Path analysis result and the above summary,each variable (service quality, service benefit, price, corporate image, and system quality) has direct influence toward consumer loyalty. However, on the other side, they also have indirect influence through consumer satisfaction. On direct influence Path, service quality has influence in the amount of 0.589 toward consumer loyalty, while service benefit has influence in the amount of 0.494 toward consumer loyalty, price‘s influence in the amount of 0.714 toward consumer loyalty, while corporate image also has influence in the amount of 0.565 toward consumer loyalty, and system quality in the amount of 0.638 toward consumer loyalty. Moreover, when those variables‘ influence value is combined with indirect influence through consumer satisfaction, then the total amount of influence for each variable toward consumer loyalty show the following:
- service quality with total amount of influence 0.825,
- service benefit with total amount of influence 0.747,
- price with total amount of influence 0.986,
- corporate image with total amount of influence 0.767,
- system quality with total amount of influence 0.899.
Based on those results, it can be concluded that among five variables, price has the highest amount of influence (both direct and indirect) toward consumer loyalty. Many researchers believe that price has become the most important factor, determining customers‘ satisfaction, then loyalty. According to Virvilaite, Saladiene, and Skindaras (2009), in many marketing literatures price element in service industry was indicated as the most important factor, influencing the level of consumers‘ satisfaction and loyalty, because if consumer estimate the value of obtained service, they usually think of price (p.97). Furthermore, Maztler, Würtele, and Renzl (2006) also argued that price is an important determinant factor in purchasing and post-purchasing process, the central role of price is especially well recognized as an important variable in services with complex structure, rather than tangible product (p.217). While product, distribution, and promotion involve the outlay of resources, price is the one element of the marketing mix that has direct influence to an inflow of resources. Therefore, in order to increase level of consumer loyalty, in setting pricing strategy company has to consider and pay more attention regarding the element of price satisfaction which is proved has significant influence toward consumer loyalty. Based on respondents‘ response summary it can be affirmed that more than 90% of respondents satisfy with price strategy, which is implemented by both ride hailing service providers. Respondents also agree that price offering from company is accurate and clearly informed since the beginning of booking process, and it is also worth with service quality. They also argue their service providers‘ main preferences have better offering compare to its competitor, then company‘s price offering also favorable, have no hidden cost, and socially accepted. Price-Quality ratio dimension get the highest score average among other dimensions. For company, this dimension is important to ensure that consumer keep loyal with the service. This loyalty occurs because consumers feel satisfy with the cost and service quality that they obtain. According to Matzler, Würtele, and Renzl (2006), if perceived quality exceeds perceived cost, customer value is high, however, if cost exceeds quality, customer value is low (p.220). Hereafter, this finding is also supported by the result of regression analysis, which shows that Price variable has influence in the amount of 66.9% toward consumer loyalty. T-Test and F-Test results also confirm it through accept H3 and H8 in this research. It means that price variable has positive, significant, and simultaneous influence (through consumer satisfaction) toward consumer loyalty on ride-hailing services in Surabaya. In the same time, result analysis also indicates that other variables such as, service quality, service benefit, corporate image, and system quality also have both significant and simultaneous influence (through consumer satisfaction) toward consumer loyalty. In addition, based on simple regression test result, it shows that service quality has influence in the amount of 50.5% toward consumer loyalty, whereas service benefit also has effect in the amount of 52.6% toward consumer loyalty variable. In other side, corporate image and system quality also have influence in the amount of 55.1% and 58.3% toward consumer loyalty on ride-hailing service in Surabaya. However, if those variables are integrated with consumer satisfaction variable, multiple regression test results point out that every variable (service quality, service benefit, price, and system quality) and consumer satisfaction have significant influence toward ride-hailing service in the amount of 51.8%, 49.7%, 54.3%, 56.8% orderly. In terms of service quality variable of ride-hailing providers, reliability dimension has the highest score among other dimensions. Providers‘ ability in deliver promised-service is important for customers, it is because before they decide to use the service from particular providers, they will assess whether company is able to give promised-service or not. According to Alamgir and Shamsuddoha (2003), service quality is determined by the gap between customers‘ perceived service performance and their evaluation after they receive the service (p.1). Consumer satisfaction toward this service quality may lead them to become loyal with the service (Zeithaml, Gremler, & Bitner, 2018, p.79). For service benefit that both providers offer, we know they offer loyalty program in the form of pointbased program, which customer can earn the points after use one of their service (it can from transportation service or others). Customers can collect its point, then redeem it for further fare discounts or other interesting promotion (dining voucher, spa discounts, etc.). Relationship marketing aims to create lifetime customers because when customers have a relationship with a company, they are ready to forget any other competitor offer. Consumer satisfaction toward ride-hailing providers‘ loyalty program will may lead them to become loyal with the service. This finding emphasizes on their satisfaction toward this program. A study from Selnes (1993) also found that consumer may be loyal with certain product or service because they feel satisfy with it and tend to want to continue the relationship with the company (on Richard & Zhang, 2012, p.573). Furthermore, among of three elements of corporate image, based on research finding it indicates that corporate value has the highest responses score average. It means that most of respondents agree that ridehailing companies offer good or suitable value to their customers in the process of service delivery. According to Lovely Personnel University (2012), corporate value refers to the ratio of perceived benefits of the service to be purchased to price and other added cost (p.197). It also refers to what companies try to offer to its stakeholders through a decision, strategy, interactions, which distinguish them with others. Clearly, once customer has had a first service encounter with the company, their image will influence further activities regarding the company‘s product or service. Therefore, it is important to develop strong corporate image because it can lead to customer preference for first time customers as well as loyalty for existing customers (Bravo, Montaner, and Pina, 2010). On system quality variable, easy-to-use dimension has the highest average score. This dimension is also very related with how company offers easy navigation for customers in accessing any kind of information in their platform. Respondents argue the system is free-of-effort in operate it and provide an easy channel to access and gather any kind of information regarding customers‘ account. The easiness element of ride-hailing application is important both for consumer and company itself. Because in this industry, the application system has main role as platform that connect drivers‘ partners and potential passengers, therefore the application should be easy to use. Both companies have to be able to always ensure that their platform is met consumes‘ expectation and always provide regular improvement to accommodate consumers‘ needs. Schultz and Bailey (2000), on their study contend that consumer satisfaction is a good starting point to developing and measuring the level of consumer loyalty, because a satisfied customer tents to remain more loyal with the brand or service, than an unsatisfied consumer (on Richard & Zhang, 2012, p.573).
IV. CONCLUSION and RECOMMENDATIONS
This study affirms that price variable has become the most dominant factor that influence consumer loyalty, both directly and indirectly (through consumer satisfaction), on ride-hailing services in Surabaya. Moreover, from research analysis, both regression test and Path analysis, other variables, such as service quality, service benefit, corporate image, and system quality also have significance direct influence toward consumer loyalty, and simultaneous influence through consumer satisfaction. However, if we compare the amount of influence from regression test or Path analysis, mostly direct influences have bigger number than indirect through consumer satisfaction. Seeing the fact that price has become dominant factor that influence consumer loyalty on ride-hailing service in Surabaya, both service providers must maintain and pay more attention to their price strategy. In every strategy implementation they must always ensure that it meets the customers‘ expectation and satisfy them. Thisresearch also finds that corporate identity and service benefit elements have the lowest response average. In parts of rectify these variables, both companies must improve their ‗current identity‘ without losing their ‗true identity‘, so customers can be more attracted with it and it may increase their satisfaction and loyalty. Furthermore, the ride-hailing services also must upgrade their loyalty programs to increase consumer satisfaction, for instance by increasing point earning from each transaction, and expanding benefits of loyalty programs such as providing free riding or digital money voucher. Since this research is using quantitative approach, the results may not be able to give deeper explanation regarding the true reasons why this phenomenon happens. Therefore, to enrich the findings further study can be developed using qualitative approach. As this research only touches on the Two-Wheeler service, future research may be able to use this study variables to be implemented on the Four-Wheeler (car) service so that the results can enhance people‘s understanding regarding this new phenomenon in urban transportation. It will be also interesting if future research can study the effect of Coronavirus (Covid-19) pandemic to the ridehailing businesses.
REFERENCES
[1] Potkin, F. (2018, August 17). Indonesia’s Go-Jek close to profits in all segments, except transport: CEO. From https://www.reuters.com/article/us-indonesia-gojek-interview/indonesias-go-jek-close-toprofits-in-all-segments-except-transport-ceo-idUSKBN1L20SI
[2] Wardani, A. S. (2019, March 6). Diunduh 125 Juta Kali, Ini Data-Data MencengangkanSoal Gojek. From https://www.liputan6.com/tekno/read/3909969/diunduh-125-juta-kali-ini-data-datamencengangkan-soal-gojek
[3] Paskalis, Y. (2018, March 27). Intip Peta Kekuatan Armada Go-Jek Versus Grab (A. N. Hidayat, Ed.). Fromhttps://bisnis.tempo.co/read/1073905/intip-peta-kekuatan-armada-go-jek-versusgrab/full&view=ok
[4] Consuegra, D., Molina, A., & Esteban, À. (2007). An Integrated Model of Price, Satisfaction and Loyalty: An Empirical Analysis in Service Sector. Journal of Product & Brand management, 16(7), 459-468.
[5] Magatef, S. G., &Tomalieh, E. F. (2015). The Impact of Customer Loyalty Programs on Customer Retention. International Journal of Business and Social Science,6(8), 78-93.
[6] Riana, F. (2017, May 12). Transportasi Online, YLKI: 72,6 PersenGunakan Go-Jek, From https://metro.tempo.co/read/874563/transportasi-online-ylki-726-persen-gunakan-go-jek/full&view=ok
[7] Mamun, A. A., Rahman, M. K., & Robel, S. D. (2014). A Critical Review of Consumers‘ Sensitivity to Price: Managerial and Theoretical Issues. Journal of International Business and Economic,2(2), 1-9.
[8] Lovely Personnel University. (2012). Services Marketing. New Delhi: Excel Books Private Limited.
[9] EConsultancy. (2012). Digital Marketing and E-Commerce Careers Guide. EConsultancy Digital Marketers United, 1–31.
[10] Octaria, F. D. (2016). Consumer Insight: Strategy Kampanye Gojek Street Smart Driving. Tarumanegara University Paper, 1–32.
[11] Wahid, U., &Puspita, A.E. (2017). UpayaPeningkatan Brand Awareness PT. Gojek Indonesia MelaluiAktivitas Marketing Public Relations. JurnalKomunikasi, 9(1), 31-43.
[12] Khuong, M. N., & Dai, N. Q. (2016). The Factors Affecting Customer Satisfaction and Customer Loyalty — A Study of Local Taxi Companies in Ho Chi Minh City, Vietnam. International Journal of Innovation, Management and Technology,7(5), 228-233.
[13] Phuong, N., & Trang, T. (2018). Repurchase Intention: The Effect of Service Quality, System Quality, Information Quality, and Customer Satisfaction as Mediating Role: A PLS Approach of M-Commerce Ride Hailing Service in Vietnam. Marketing and Branding Research, 5, 78–91.
[14] Alamgir, M., & Shamsuddoha, M. (2004). Service Quality Dimensions: A Conceptual Analysis. The Chittagong University Journal of Business Administration, 19, 1–11.
[15] Zeithaml, V., Bitner, M. J., &Gremler, D. D. (2018). Service Marketing: Integrating Customer Focus Across The Firm (7th ed.). New York: McGraw-Hill Education.
[16] Sharp, B., Sharp, A. (1997). Loyalty Programs and their Impact on Repeat-purchase Loyalty Patterns, International Journal of Research in Marketing, 14(5), 473-486.
[17] Jokinen, T. (2014). Customer Loyalty Program. Saimaa University of Applied Science, 1-57. [18] Kotler, P., & Armstrong, G. (2012). Principle of Marketing (14th ed.). New Jersey: Pearson Prentice Hall.
[19] Matzler, K., Würtele, A., &Renzl, B. (2006). Dimensions of price satisfaction: a study in the retail banking industry. International Journal of Bank Marketing, 24(4), 216–231.
[20] Virvilaite, R., Saladiene, V., &Skindaras, D. (2009). The Relationship between Price and Loyalty in Services Industry. InzinerineEkonomika-Engineering Economics,3, 96-104.
[21] Gray, E., & Balmer, J. (1998). Managing Corporate Image and Corporate Reputation. Long Range Planning, 31(5), 695–702.
[22] Hu, H-H., Kandampully, J. &Juwaheer, T.D. (2009). Relationships and Impacts of Service Quality, Perceived Value, Customer Satisfaction, And Image: An Empirical Study. The Service Industries Journal, 29(2), 111-125.
[23] Bravo, R., Montaner, T. & Pina, J.M. (2010). Corporate Brand Image in Retail Banking: Development and Validation of a Scale. The Service Industries Journal, 30(8) 1199– 1218.
[24] Richard, J., & Zhang, A. (2012). Corporate image, loyalty, and commitment in the consumer travel industry. Journal of Marketing Management, 28(5), 568–593.
[25] Suhami, M. Z., Talib, S. A., Bachok, S., & Saleh, M. M. (2018). Service attributes, customer satisfaction and return usage: A case of Uber Malaysia. Journal of Tourism, Hospitality & Culinary Arts, 10(2), 81–103.
[26] McMullan, R., & Gilmore, A. (2008). Customer Loyalty: An Empirical Study. European Journal of Marketing,42(9), 1084-1094.
[27] Ehrenberg, A.S.C., and Goodhardt, G.J. (2000). New Brands: Near Instant Loyalty. Journal of Marketing Management, 16, 607-617.
[28] Stevens, T. (2000). The Future of Visitor Attractions. Travel and Tourism Analyst, 1, 61-85. [29] Išoraitè, M. (2016). Customer Loyalty Theoretical Aspect. Ecoforum,5(2), 9th ser., 292-299. [30] Apuke, O. D. (2017). Quantitative Research Methods A Synopsis Approach. Arabian Journal of Business and Management Review, 6(10), 40–47.
[31] Rehman, A. A., &Alharthi, K. (2016). An Introduction to Research Paradigms. International Journal of Educational Investigations, 3(8), 51–59.
[32] Gogtay, N. J., &Thatte, U. M. (2017). Principles of Correlation Analysis. Journal of The Association of Physicians of India, 65, 78–81.
[33] Schneider, A., Hommel, G., &Blettner, M. (2010). Linear Regression Analysis. DeutschesÄrzteblatt International, 107(44), 776–782.
[34] Ridwan, &Kuncoro, E. A. (2013). Cara Menggunakan dan Memakai Path Analysis (AnalisisJalur). Bandung: Alfabeta
[35] Uyanik, G. K., &Guller, N. (2013). A study on Multiple Linear Regression Analysis. Social and Behavioural Science, 106, 234–240.
[36] Kenton, W. (2020, February 19). T-Test. Retrieved from https://www.investopedia.com/terms/t/ttest.asp
[37] Kissel, R., &Poserina, J. (2017). Optimal Sports Math, Statistics, and Fantasy. Academic Press.
[38] Stage, F. K., Carter, H. C., & Nora, A. (2010). Path Analysis: An Introduction and Analysis of a Decade of Research. The Journal of Educational Research, 98(1), 5–13.
[39] Indo Telko. (2019, July 31). Survei: Konsumenlebihamangunakan Gojek dibanding Grab. From https://www.indotelko.com/read/1564547336/konsumen-gojek-grab
[40] Haryanto, A. T. (2017, May 9). MayoritasPengguna Go-Jek Perempuan Single. from https://inet.detik.com/cyberlife/d-3496233/mayoritas-pengguna-go-jek-perempuan-single [41] Jakarta Post. (2018, February 20). Go-Jek most popular ride-hailing app: Survey. from https://www.thejakartapost.com/life/2018/02/20/indonesias-most-popular-ride-hailing-app-survey.html.
[42] Chandler, C. (2019, March 20). Grab vs. Go-Jek: Inside Asia‘s Battle of the ‗Super Apps.‘ Retrieved February 6, 2020, from https://fortune.com/longform/grab-gojek-super-apps/
[43] Ghozali, I. (2013). AplikasiAnalisis Multivariate dengan Program IBM SPSS 21 (7th ed.). Semarang: Badan PenerbitUniversitasDiponegoro.
APPENDIX
Link sumber jurnal: https://www.ajhssr.com/wp-content/uploads/2020/03/ZZF2043453463.pdf